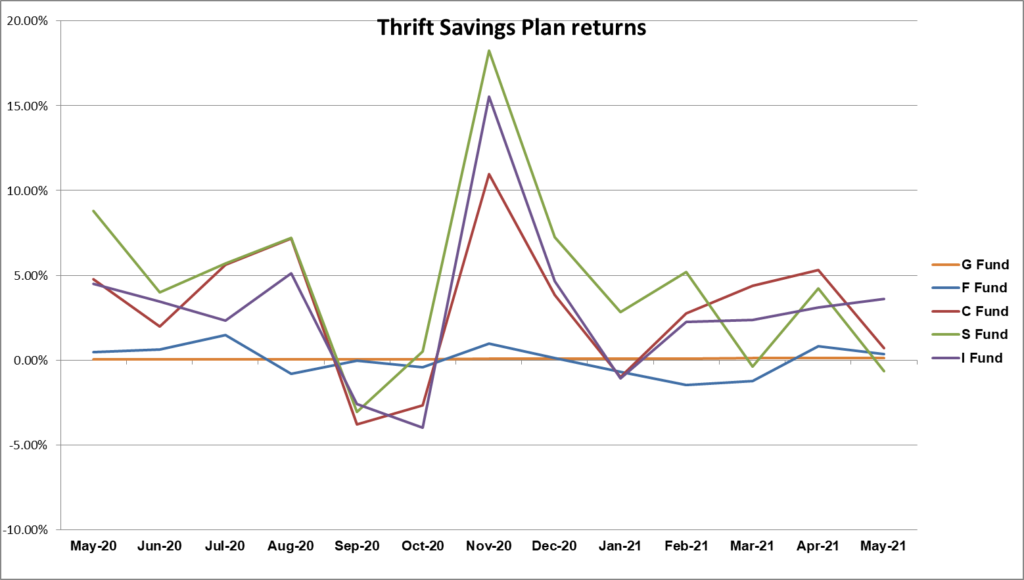
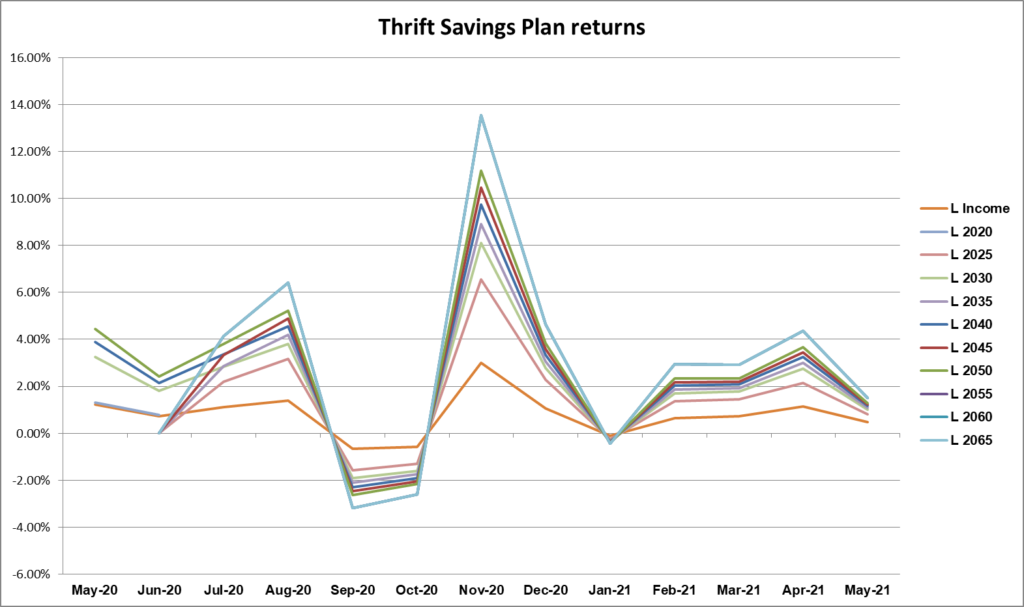
The Thrift Savings Plan took a turn for the worse in May, as all the funds except G and I fell from their April returns. That said, the S Fund was the only one to dip into the red. Every other fund remained positive.
This isn’t unusual behavior; most TSP funds have dropped from April to May for the past two years, sometimes much more drastically. For example, in 2019, both C and S funds lost more than 10 percentage points during that time.
The international stock index I fund was the clear winner this May, coming in at 3.61%, which is a 0.52 percentage point increase over April’s returns. That keeps its year-to-date performance strong at 10.58%. Meanwhile, the securities-backed G fund held steady at 0.13%, neither gaining nor losing ground. Its year-to-date returns stand at 0.53%.
The rest of the TSP funds did not fare so well. The small capitalization stock index S fund saw the biggest drop, falling 4.89 percentage points to come in at -0.66%, the only fund to dip into the red. Despite this, its year-to-date returns remain high, standing at 11.60%. The common stock index investment C fund saw the next biggest drop, falling 4.64 percentage points to wind up at 0.69%. Its year-to-date returns are highest out of all the funds, at 12.61%. The fixed income investment F fund only fell slightly, from 0.82% to 0.34%, though a string of poor performance earlier in the year has left it with a year-to-date return of -2.22%.

The Lifecycle funds all followed suit, with downturns ranging from 0.67 percentage points to 2.85 percentage points. The L Income had the smallest downturn as well as the smallest return, at 0.47%. Returns and downturns scaled up from there, with the L 2055, 2060 and 2065 funds all showing the greatest decrease, coming in at 1.50%.

| Thrift Savings Plan — May 2021 Returns | ||||
| Fund | May | Year-to-Date | Last 12 Months | |
| G fund |
|
0.53% | 0.96% | |
| F fund | 0.34% | -2.22% | -0.29% | |
| C fund | 0.69% | 12.61% | 40.29% | |
| S fund | -0.66% | 11.60% | 62.54% | |
| I fund | 3.61% | 10.58% | 39.15% | |
| L Income | 0.47% | 2.88% | 9.22% | |
| L 2025 | 0.81% | 5.61% | n/a | |
| L 2030 | 1.00% | 7.07% | 24.77% | |
| L 2035 | 1.08% | 7.71% | n/a | |
| L 2040 | 1.16% | 8.36% | 29.97% | |
| L 2045 | 1.22% | 8.91% | n/a | |
| L 2050 | 1.28% | 9.49% | 34.66% | |
| L 2055 | 1.50% | 11.70% | n/a | |
| L 2060 | 1.50% | 11.70% | n/a | |
| L 2065 | 1.50% | 11.70% | n/a |


Comments are closed.